

Can a metrologist trust CT data?
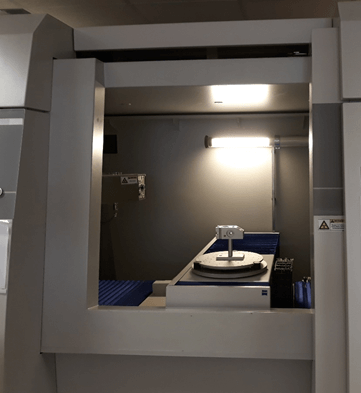
This is a question often asked at trade shows, after the always impressive moment of the live demonstration of the operation of a CT. A demonstration which begins with the ritual door closing. The massive shielded door closes delicately and, through its window, offers a glimpse of our parts slowly rotating in the X-ray beam. We are hypnotized by the rotating stage which runs like clockwork, the presence of marble and granite, and the stabilized temperature, all of which irresistibly inspire confidence. This outstanding rigor and solidity are highlighted by the sales engineer… But what if all this is hiding something? Before you even have the time to think about it, your part is already displayed spinning in 3D on the giant screen and your sales engineer is producing a series of measurements with increasing precision with 3, 4 or 5 digits after the point. You only have to ask… But, once again, what if all this is hiding something?
Uncertainty traditionally induced by the materials and the system itself, but not only
To settle this question, Jon O’Hare of the Hexagon Group carried out an in-depth study which he explains in an excellent presentation (click this link to download).
After indicating the causes of uncertainty traditionally induced by the materials and the system itself, he singles out the software as a significant factor (can be the most important) of this uncertainty. Within the software component he identifies the method of determining the surface and the calculation method as two key points. So how is the surface determined from the part’s digitized data?
Here there is no probe like on a three-dimensional measuring machine, and therefore no physical boundary. But instead, an image file with grayscale representing the boundaries between the materials and the exterior.
Isosurface value
The most widely used method is to take a value, also called Isosurface, and to make a representation of the part from this boundary value.
This works very well if we wish to visualize the part and take some informative measurements but at the expense of precision and repeatability.
Firstly because this method is often user dependent: on most software applications the threshold is a variable which can be changed in the interface. But even if the user does not change it, we can legitimately ask ourselves which threshold the application will use in an automatic procedure.
Jon clearly demonstrates that for the classic case of a hollow circular part the values of the inner and outer boundaries are different.
The software affects the data
This is easily explained by the fact that the void inside the part will not have exactly the same intensity (and therefore gray value) as the void inside the part (since the X-rays are attenuated).
But the measurements differ significantly according to whether the software takes the inner boundary value or the outer boundary value of the wall.
In Jon’s example we note a difference of 25 microns in the same measurement according to the threshold chosen. This is considerable and it is normally the case that the software applications use an automatic isovalue which, by default, is the mean of the maximum and minimum intensity of the wall boundary.
The bad news is that for reasons of calculation time and simplicity the isovalue is the technique used when you make a surface export (Mesh) of your tomograph file (Voxel). For this reason alone, using a mesh export for tomography measurements should therefore be avoided.
So is there a reliable method for exactly determining the surface of a part scanned by a tomograph?
In theory, it seems there is, it is the local thresholding approach. At each point a search area is defined which indicates its extent with an associated vector which gives it the search direction. Based on this data it is easy to set up a detection to exactly locate the boundary. The contours are therefore checked point by point, without averaging or approximation. This is all done automatically, so it is a self-adaptive point-by-point method of determining the surface.
So much for the theory, it is now easier to understand why the use of mesh files and exports based on the isovalue is not a good solution for use in CT metrology. We will shortly be taking another look at the results of Jon’s experiments and we will show what the self-adaptive methods approach contributes to the measurement precision.
[/fusion_text][/fusion_builder_column][/fusion_builder_row][/fusion_builder_container]